
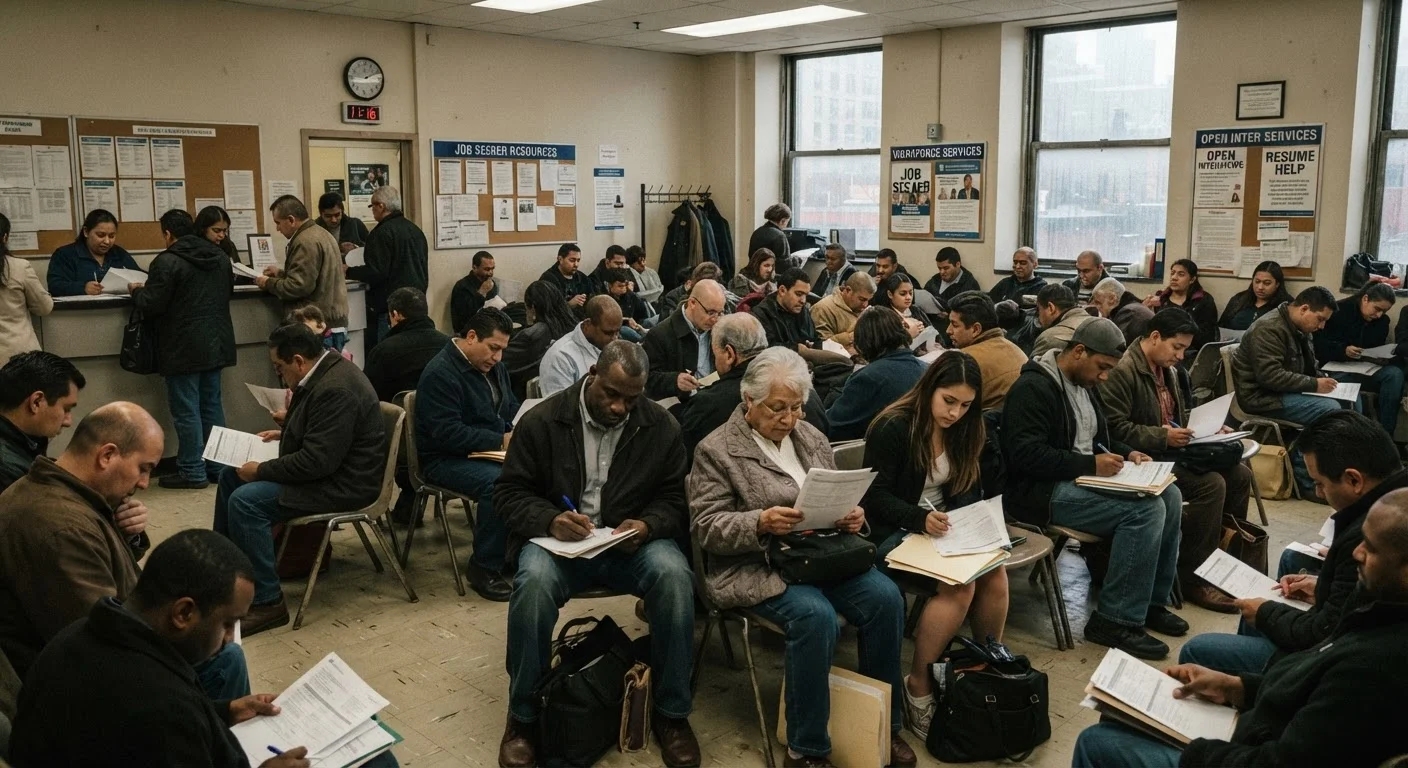
What the Headline Rate Actually Counts
Every month, the Bureau of Labor Statistics (BLS) releases a jobs report, and the unemployment rate — technically called the U-3 — dominates the news. But the U-3 has a specific, narrow definition: it counts people who are jobless, available to work, and have actively looked for a job in the past four weeks. Anyone outside those criteria simply doesn't appear in the number.
That sounds reasonable until you consider who gets left out. Workers who gave up searching, people working part-time because full-time work isn't available, and those in informal or gig arrangements that provide little stability are all largely invisible to the headline figure. When a president or economist says unemployment is low, they are technically correct — but only within those boundaries.
For a fuller picture, the BLS also publishes a broader measure called the U-6, which includes marginally attached workers and those who are working part-time for economic reasons. The U-6 has historically run several percentage points higher than the U-3. Understanding the difference is essential for connecting macroeconomic news to what workers actually experience. See our guide to key economic indicators for context on how these figures fit alongside GDP, inflation, and other data.
Common Myths — and the Facts Behind Them
Public understanding of unemployment is shaped by headlines that rarely explain the underlying methodology. That gap leaves room for persistent misconceptions — ones that affect how people interpret economic news and even how they assess their own situations.
Myth
If the unemployment rate is low, most people who want jobs have them.
Fact
The official rate excludes discouraged workers and those in involuntary part-time jobs, so it can look low while significant labor market slack remains.
The U-3 only counts people who actively searched for work in the past four weeks. Someone who stopped looking — perhaps after months of rejections — is classified as "not in the labor force" and vanishes from the statistic entirely. The BLS refers to these individuals as "discouraged workers." When their numbers are large, the headline rate can appear artificially healthy.
Myth
People who are working part-time are counted as fully employed.
Fact
Part-time workers are counted as employed in the U-3, regardless of whether they want or need full-time hours.
A worker clocking 10 hours a week at a retail job because no full-time position is available is categorized as employed in the official rate. The BLS does track "part-time for economic reasons" separately, and this group is reflected in the broader U-6 measure — but that number rarely leads the news cycle. During economic downturns, the share of involuntary part-time workers tends to rise significantly, even as the headline rate stays relatively contained.
Myth
A falling unemployment rate always means the economy is adding good jobs.
Fact
The rate can fall because people leave the labor force, not because job quality or quantity is improving.
When workers stop searching for employment — due to discouragement, caregiving responsibilities, disability, or early retirement — they exit the denominator of the unemployment calculation. This mechanical effect can pull the rate down without a single new job being created. Analysts therefore watch labor force participation alongside the unemployment rate to avoid misreading a drop as unambiguously positive news.
Myth
Low unemployment means wages are rising fast enough for workers to get ahead.
Fact
Wage growth and unemployment are related but separate measures; inflation can erode nominal wage gains even in a tight labor market.
Tight labor markets do typically put upward pressure on wages, but whether those gains translate to improved living standards depends on inflation. When prices for housing, groceries, and healthcare rise faster than paychecks, workers effectively lose ground even as their nominal wages climb. This is why economists track "real wages" — wage growth adjusted for price changes — as a separate and arguably more meaningful indicator of worker well-being.
Myth
The unemployment rate treats all racial and demographic groups equally.
Fact
Unemployment rates vary significantly by race, age, education level, and geography, differences the headline figure does not surface.
The BLS publishes disaggregated unemployment data showing persistent gaps across demographic groups. Historically, Black and Hispanic workers have experienced unemployment rates measurably above the national average, even during periods of overall labor market strength. A single national number averages across those disparities, which can obscure where economic distress is concentrated and who is most vulnerable to downturns.
The Numbers Behind the Gap
~2–4 pts
Typical gap between U-6 and U-3 rates
The BLS U-6 measure has historically run several percentage points above the headline U-3, revealing a larger pool of underemployed and marginally attached workers.
~62–63%
U.S. labor force participation rate, recent years
The share of working-age Americans either employed or actively job-seeking has remained below pre-2008 levels, according to BLS data, reflecting long-run structural shifts in the workforce.
Millions
Involuntary part-time workers in the U.S.
In most recent BLS reports, several million Americans work part-time solely because full-time work is unavailable to them — a group absent from the headline unemployment rate.
These figures illustrate why the distance between the official unemployment rate and the lived experience of workers can be so wide. Labor force participation — the share of working-age adults who are either employed or actively job-hunting — has trended lower over the past two decades due to factors including an aging population, caregiving demands, and, according to some labor economists, discouragement among workers who see limited prospects.
Wage growth adds another layer of complexity. Even when more people are employed, real wages (adjusted for inflation) may not be keeping pace with the cost of living. This dynamic is explored more fully in our coverage of why earning more can still feel like falling behind.
How to Read Jobs Reports More Critically
Reporters, policymakers, and everyday Americans can all make better use of the monthly jobs report by looking beyond the U-3. A few key questions worth asking whenever a new report is released:
- What is the U-6 rate? This broader measure includes part-time workers who want full-time hours and marginally attached workers who have recently given up searching.
- Is labor force participation rising or falling? A falling unemployment rate that coincides with a falling participation rate may reflect people leaving the workforce, not finding jobs.
- Are the jobs being added full-time or part-time? A surge in part-time positions tells a different story than an equivalent rise in full-time employment.
- What is happening to wages in real terms? Nominal wage growth means little if it is outpaced by inflation.
The rise of gig and contract work adds a further complication: many gig workers are counted as employed even when their income is unpredictable and they lack benefits. Our reporting on the gig economy's hidden trade-offs examines what that distinction means for workers in practice. Similarly, if you encounter trend reports that cite employment statistics, understanding how to evaluate those claims is a useful skill to develop.
Economic data is a starting point, not a verdict on how any individual worker is faring. Treating the unemployment rate as one imperfect signal — rather than a definitive measure of economic health — leads to more informed conclusions.