Where the Poverty Line Came From
The formula behind America's official poverty line was developed in the early 1960s by Mollie Orshansky, a Social Security Administration economist. Her approach was straightforward for its time: surveys showed that low-income families spent roughly one-third of their income on food, so she took the cost of a minimum adequate diet and multiplied it by three to estimate total subsistence-level income.
That calculation formed the basis of what became the federal poverty thresholds, formally adopted for government use in 1969. Since then, the dollar figures have been adjusted annually for inflation — but the underlying structure has remained largely the same. Decades of demographic, economic, and social change have not altered the core methodology.
Understanding why this matters requires recognizing how much American household budgets have shifted. Food now represents a far smaller share of household spending than it did in the 1960s, while housing, healthcare, childcare, and transportation consume much larger portions. A formula anchored to food costs therefore captures today's economic realities only imperfectly. As economic indicators every working American should know explains, the measures governments use to track well-being often have structural limits worth understanding.
What the Official Measure Actually Counts
The Official Poverty Measure compares a household's pre-tax cash income against the relevant poverty threshold for that household size. For 2024, the federal poverty level for a single person was set at approximately $15,060 per year; for a family of four, it was roughly $31,200. These figures are the same nationwide, regardless of where a family lives.
The measure counts wages, salaries, Social Security payments, and most other forms of direct cash income. What it does not count is significant: noncash government benefits such as SNAP (food assistance), housing vouchers, and the value of Medicaid are excluded from the resource side of the equation. Similarly, tax credits — including the Earned Income Tax Credit, which is one of the largest anti-poverty tools in the federal arsenal — are not reflected in the official calculation.
37.9M
Americans in official poverty (2022)
According to the U.S. Census Bureau's 2022 American Community Survey, approximately 37.9 million people fell below the official poverty threshold that year.
~12.4%
Official U.S. poverty rate in 2022
The Census Bureau reported an official poverty rate of approximately 12.4% for 2022, up from 7.8% in 2021 when expanded pandemic-era tax credits were in effect.
1963
Year the poverty formula was first developed
Economist Mollie Orshansky developed the foundational methodology for the federal poverty threshold in 1963; it was formally adopted by the federal government in 1969.
This creates a measurement paradox. A policy intervention can successfully lift a household's effective financial resources while leaving that household statistically below the poverty line — because the form of assistance doesn't register in the official count.
The Supplemental Poverty Measure: A Broader View
To address the known gaps in the Official Poverty Measure, the U.S. Census Bureau developed the Supplemental Poverty Measure (SPM), which has been published annually since 2011. The SPM takes a different approach on both sides of the ledger.
On the resource side, it includes the value of noncash benefits and tax credits. On the threshold side, it attempts to reflect actual spending on food, clothing, shelter, and utilities — adjusted for regional cost differences. The SPM also subtracts necessary work expenses, out-of-pocket medical costs, and taxes paid.
The result is a more nuanced picture. In some years, the SPM shows a lower poverty rate than the official measure — in part because it captures how much government programs reduce hardship. In other years or for particular demographic groups, it shows a higher rate, exposing pockets of need the official count misses.
The critical limitation is that the SPM is an analytical tool, not a policy tool. Federal and state agencies still use the Official Poverty Measure — not the SPM — to determine who qualifies for assistance programs. The measurement that shapes real-world eligibility decisions remains the older, narrower one.
What the Poverty Line Misses
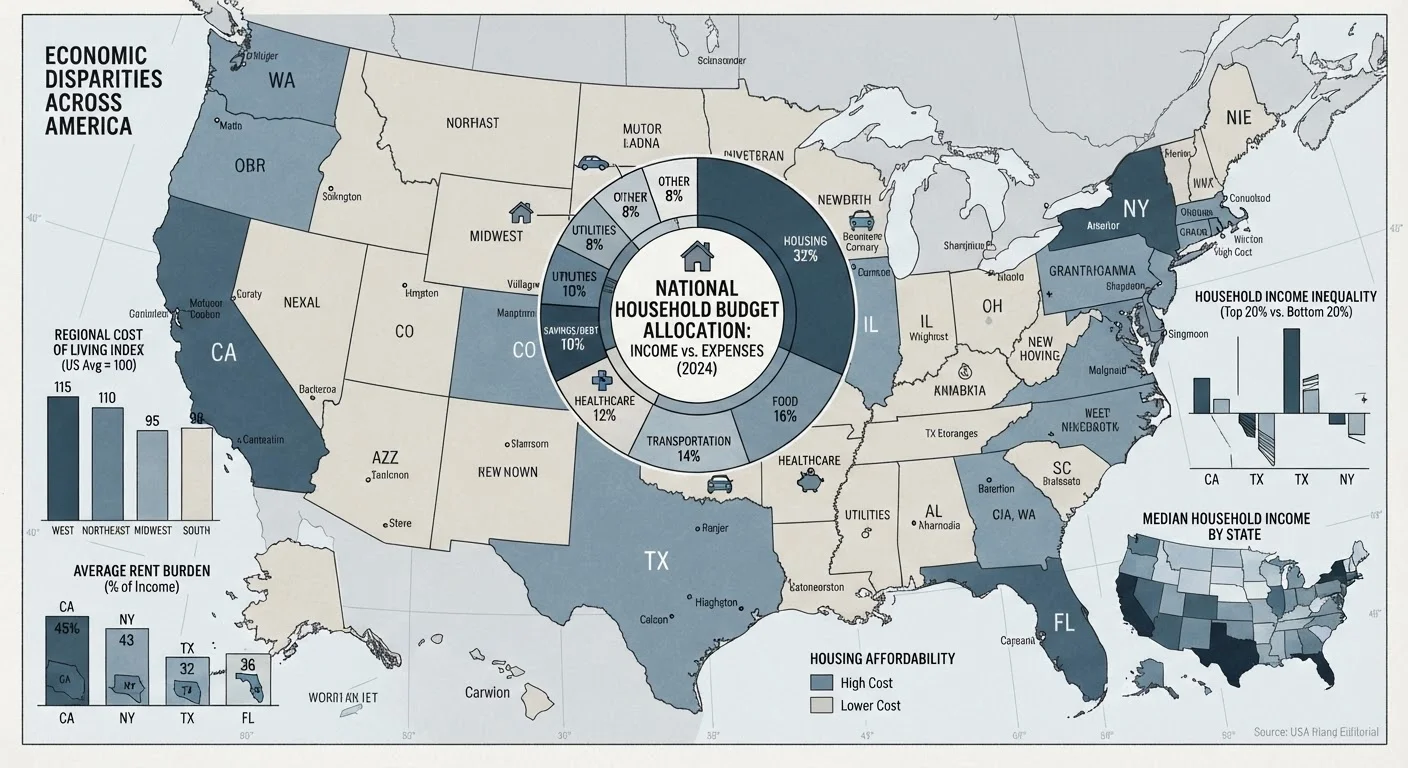
Geographic variation is one of the most widely cited gaps. The federal poverty line is a single national number, but the cost of a basic standard of living varies enormously across the United States. A family earning $40,000 in a rural Midwestern town occupies a very different economic position than a family earning the same amount in New York City or San Francisco, where median rents alone can exceed that figure.
This geographic blindness has real consequences. Families in high-cost areas who technically earn above the poverty line may struggle to afford housing, healthcare, or adequate childcare — costs that have risen faster than inflation in many metropolitan regions. How inflation changed what Americans prioritize illustrates how price pressures cascade through everyday decision-making well beyond what any single income threshold captures.
The poverty line also struggles with household complexity — multigenerational living arrangements, varying healthcare needs, disability-related expenses, and the economic situations of people who cycle in and out of formal employment. Much like the way unemployment statistics can mask the true state of the labor market — as explored in why the low unemployment headline doesn't always tell the full story — the official poverty rate can present a cleaner picture than the underlying data supports.
Looking Beyond a Single Number
When evaluating poverty-related policy proposals, check which measure — the Official Poverty Measure or the Supplemental Poverty Measure — is being cited, and whether the threshold accounts for regional costs. The same policy can look very different depending on the measuring stick used.
The wealth gap in America further complicates the picture: income-based poverty measures say nothing about assets, debt, or the structural factors that determine long-term economic mobility.
Why the Measurement Still Matters
For all its methodological limitations, the federal poverty level carries enormous policy weight. Eligibility thresholds for Medicaid are typically set at a percentage of the FPL — often 138% for adults under the ACA's Medicaid expansion. SNAP eligibility is generally capped at 130% of the FPL for most households. Millions of people's access to healthcare, nutrition assistance, and other support programs is determined by where their income falls relative to this decades-old formula.
Researchers, advocates, and some policymakers have long called for a comprehensive revision of the official measure to reflect modern living costs and the full range of government support. Critics on both sides of the political spectrum argue the current threshold either understates or overstates poverty, depending on what they believe it should measure.
What is broadly agreed upon is that a single number — regardless of how it is calculated — cannot fully capture the texture of economic hardship across a country as large and varied as the United States. The poverty line is a policy instrument as much as a descriptive tool, and understanding its origins, its mechanics, and its limitations is essential context for evaluating any debate about poverty, inequality, or the scope of the social safety net.